Data source and facility-level infection rate distributions
library(dplyr)
library(ggplot2)
library(plotly)
library(kableExtra)
library(IRdisplay)
library(arrow)

# Load data
dat <- read.csv(
  "data/ca_ssi_adult_odp_2024.csv",
  header = TRUE,
  fileEncoding = "latin1"
)

# Restrict to colon procedures
colon_fac <- dat |>
  filter(Operative_Procedure == "Colon surgery") |>
  select(
    County,
    Facility_ID,
    Facility_Name,
    Hospital_Category_RiskAdjustment,
    Facility_Type,
    Procedure_Count,
    Infections_Reported,
    Infections_Predicted,
    SIR,
    SIR_CI_95_Upper_Limit,
    SIR_CI_95_Lower_Limit,
    Comparison,
    Notes
  ) |>
  mutate(observed_rate_fac = Infections_Reported/Procedure_Count)

# Use ACH only and drop pediatric facilities
colon_fac_ach <- colon_fac |>
  filter(Hospital_Category_RiskAdjustment == "Acute Care Hospital",
         Facility_Type != "Pediatric") |>
  mutate(County_numfactor = as.numeric(factor(County)),
         Facility_ID_numfactor = as.numeric(factor(Facility_ID)),
         Facility_Type = factor(Facility_Type),
         No_Infections = Procedure_Count - Infections_Reported) |>
  select(-Hospital_Category_RiskAdjustment) |>
  # pooled county-level counts and rates
  group_by(County) |>
    mutate(
      county_procedures = sum(Procedure_Count, na.rm = TRUE),
      county_infections = sum(Infections_Reported, na.rm = TRUE),
      observed_rate_county = county_infections / county_procedures
    ) |>
  ungroup()

write_parquet(colon_fac_ach, "data/colon_fac_ach.parquet")

# State mean SSI rate
state_mean <- sum(colon_fac_ach$Infections_Reported) /
  sum(colon_fac_ach$Procedure_Count)
Attaching package: ‘dplyr’


The following objects are masked from ‘package:stats’:

    filter, lag


The following objects are masked from ‘package:base’:

    intersect, setdiff, setequal, union


Attaching package: ‘plotly’


The following object is masked from ‘package:ggplot2’:

    last_plot


The following object is masked from ‘package:stats’:

    filter


The following object is masked from ‘package:graphics’:

    layout


Attaching package: ‘kableExtra’


The following object is masked from ‘package:dplyr’:

    group_rows


Warning message:
“package ‘arrow’ was built under R version 4.5.2”

Attaching package: ‘arrow’


The following object is masked from ‘package:plotly’:

    schema


The following object is masked from ‘package:utils’:

    timestamp
The data for this analysis come from the California Department of Health and Human Services. The dataset includes 2024 facility-level reports of colon surgery surgical site infections (SSIs) and was downloaded on December 28, 2025. A total of 288 non-pediatric, acute-care hospitals from 42 counties reported SSI information. The final analytic dataset includes the number of colon procedures with SSIs (numerator), the total number of colon procedures (denominator), county, and facility type. The table below shows the frequency of each facility type.
Across all facilities, 628 SSIs were reported for 29,835 colon procedures, resulting in an overall statewide pooled infection proportion (rate) of 628 ÷ 29,835 = 0.0210.
Summary statistics describing the distribution of facility-level infection proportions are shown in the table below. The “mean” refers to the unweighted mean of the facility-level proportions, in which each facility contributes equally regardless of procedure volume. This measure reflects the average facility-level rate, not the patient-level statewide rate.
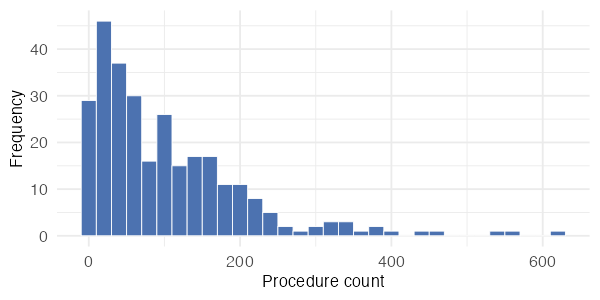
Facility colon procedure volumes are highly skewed, with most facilities performing fewer than 200 procedures. The facility with the highest volume in these data is Stanford Health Care, which performed 623 colon procedures in 2024.
Figure 2 shows the relationship between facility volume and the observed SSI rate, illustrating the statistical noise associated with small numerators and motivating the use of a hierarchical model. Hover over the plot to view facility-level details. Many facilities report only 1–6 infections, so the observed rates take on a limited set of discrete values. On the log-scaled volume axis, these discrete fractions align to form visible curved bands from the upper left to the lower right of the plot, especially among facilities with fewer than about 250 procedures. These patterns indicate that observed proportions for low-volume facilities are highly variable, highlighting the need for partial pooling in the hierarchical model.
Figure 2. Facility observed SSI rates vs. procedure volume
While Figure 2 highlights the relationship between facility volume and observed rates, it does not show how facilities are distributed within counties. Because the data are clustered geographically, with multiple facilities located in the same county, it is also useful to examine variation in observed SSI rates at the county level.
Figure 3 displays facility-specific observed SSI rates grouped by county, allowing direct comparison of facilities operating in the same local context. This visualization reveals substantial heterogeneity both within and between counties, with some counties containing facilities that span a wide range of observed rates. Such patterns suggest that county-level factors may influence baseline infection risk and further motivate the use of a hierarchical model with county-specific random effects to account for this structure.
Figure 3. Facility-specific observed SSI rates by county